AADHAAR DATA INSIGHTS
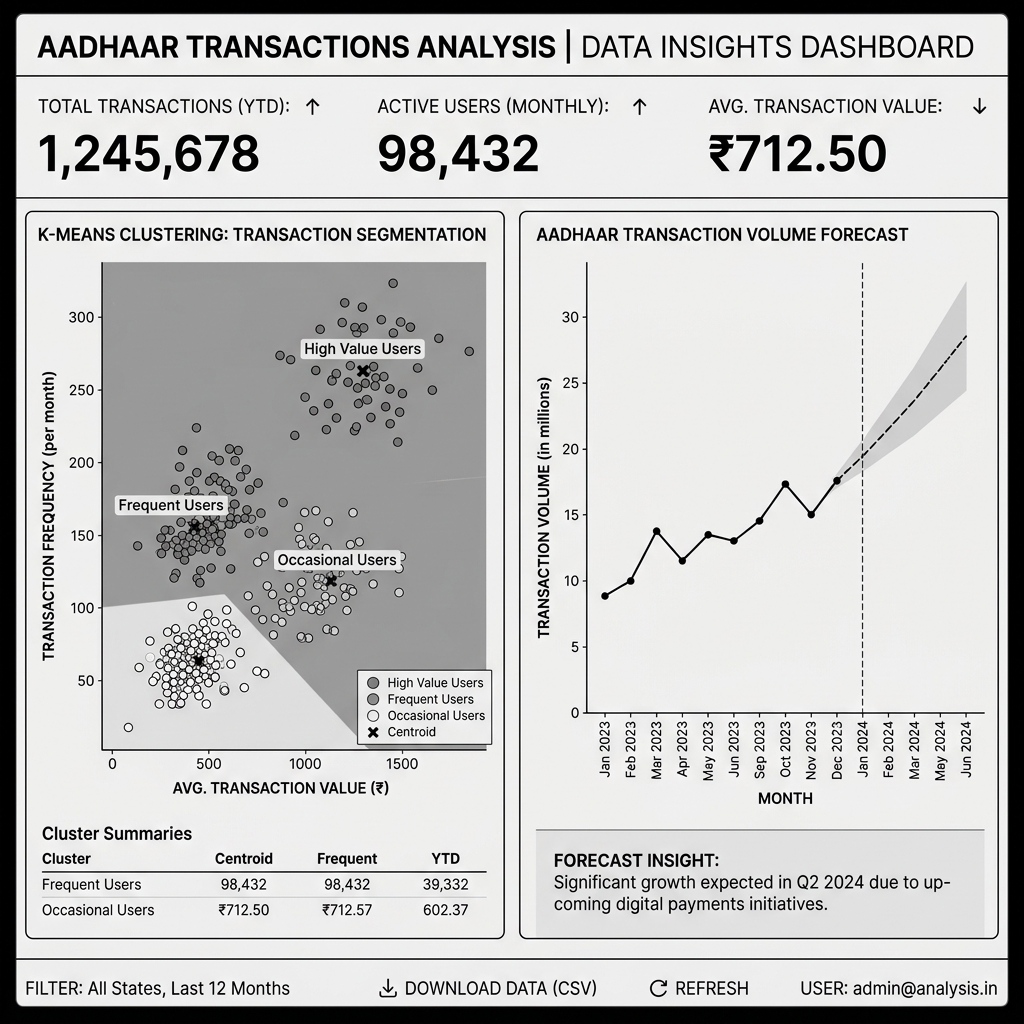
ML-powered analysis of 260M+ transactions across 39 states to discover enrollment archetypes and forecast national trends.
The Problem
The Unique Identification Authority of India (UIDAI) handles massive transaction loads. Identifying trends, center efficiency, and local enrollment anomalies across 260M+ logs is challenging due to the scale of data, noise, and geographic inconsistencies. Manual reporting struggles to outline regional behavior shifts.
What I Built
I engineered a high-throughput Python data science pipeline to ingest, clean, and model 260M+ transaction logs. I applied K-Means clustering to categorize local enrollment agencies into distinct archetypes. Using ARIMA and Prophet, I built a predictive system forecasting future transactional spikes with 85–90% accuracy, presenting findings via 13 custom interactive Plotly dashboards.
Analysis Pipeline
A logical flow of the analytical data ingestion and mapping steps:
Technical Decisions
I utilized Pandas chunk-wise parsing and memory footprint optimization to prevent RAM crashes during preprocessing. K-Means was selected due to its mathematical clarity and speed when classifying numeric features across regional centers.
Results and Impact
Developed during the UIDAI Data Hackathon 2026, the project successfully:
- Identified 4 core operational archetypes, helping allocate resources to underperforming districts.
- Achieved 85-90% forecast accuracy for predicting weekly transactional loads.